Cost Per Lead for Roofers: How to Calculate and Improve It
Cost per lead is your total ad spend divided by the number of leads it produced in the same period. Spend NZ$1,500 in a month and count 25 genuine enquiries from it, and your cost per lead is NZ$60.
The Google invoice is sitting in your inbox again. The phone rang a few times last week, two forms came through, and one of those turned into a quote for a reroof out south. You’re fairly sure the ads are paying for themselves. You’re not sure enough to raise the budget, and you can’t tell whether NZ$60 or NZ$180 is a fair price for a roofing lead in your patch. That uncertainty ends up costing more than the ads do, because it turns every spending decision into a guess.
Table of Contents
- What Cost per Lead Means and What Good Looks Like
- How to Calculate Your Cost per Lead Step by Step
- Factors That Push Your Cost per Lead Up or Down
- Cost per Lead Versus Cost per Booked Job
- Fixing a High Cost per Lead Without Cutting Your Budget
- Setting a Target Cost per Lead You Can Afford
- Confirm Your Numbers Before You Spend More
What Cost per Lead Means and What Good Looks Like
The arithmetic is one division. What trips owners up is the denominator, because a lead only counts once you’ve defined it. Write the definition down before you compare two months: a form submission with a working phone number, or a tracked call lasting more than 60 seconds, from an address inside your service area. Someone ringing about a rental they own three hours away is a lead for somebody, just not for you.
Fix that definition and NZ$60 stops looking arbitrary. It’s roughly where a well-run construction campaign in this country lands, and it sits inside a range that published benchmarks make reasonably consistent.
Three NZ figures are worth keeping in your head. The wider construction range runs from about NZ$8 to NZ$20 per click, converts 8% to 15% of clicks to leads, and lands at NZ$40 to NZ$120 per lead. Toogood Digital’s construction industry figures report specialist-trade Google Ads at about NZ$2.20 per click, 6.5% conversion and NZ$32 per lead, alongside a broader construction benchmark of roughly NZ$3.20, 5% and NZ$60.
| Benchmark | Cost per click | Click-to-lead rate | Cost per lead |
|---|---|---|---|
| NZ construction range (indicative) | NZ$8 to NZ$20 | 8 to 15% | NZ$40 to NZ$120 |
| NZ specialist trades | NZ$2.20 | 6.5% | NZ$32 |
| NZ broader construction | NZ$3.20 | 5% | NZ$60 |
Write your own number down first
Read those rows as planning ranges, not quotes for your suburb. The NZ$32 figure covers specialist trades across the board, and a roofing keyword in Auckland with four firms bidding hard behaves nothing like a gutter enquiry in Invercargill.
Pull the last three months of spend and lead counts, divide one by the other, and place your number against the range. If you’re sitting near NZ$120 with no replacement jobs to show for it, that’s worth attention this month. If you’re near NZ$40 and half the enquiries are price shoppers who never answer a follow-up call, that’s a different problem. Either way you now have a reference point instead of a feeling.
How to Calculate Your Cost per Lead Step by Step
The formula is easy. The discipline is in what you count and over what window, and that’s where most roofing accounts get a number they can’t defend.
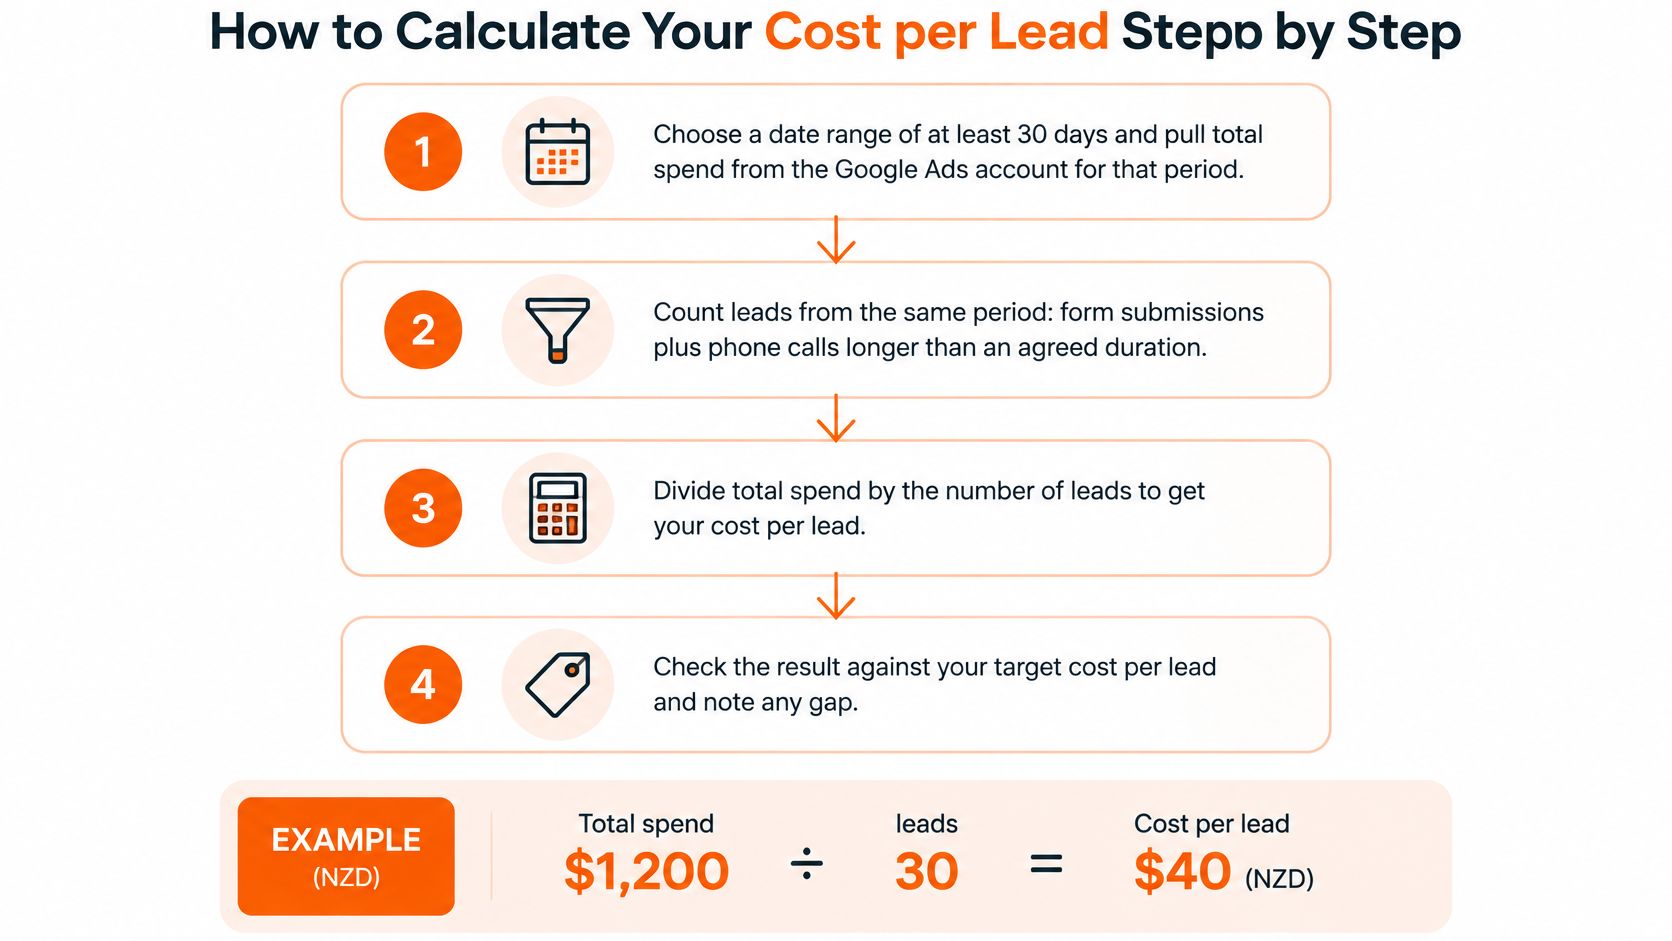
- Pick a window of 30 days or more. A single week is noise. Pull total spend from the Google Ads account for the exact dates you’ll use for leads, not from a supplier invoice covering a different period.
- Count leads from that same window. Form submissions plus phone calls over an agreed length, usually 60 seconds. Call tracking is the only reliable way to do it, because a missed call, a wrong number and a 12-minute quote conversation all look identical on a phone bill.
- Divide spend by leads. NZ$2,400 of spend against 48 counted leads gives NZ$50 per lead. Write the number and the date range down so next month’s comparison is honest.
- Clean the count before you trust it. Strip out the same caller ringing twice in seven days, obvious spam, job seekers and anyone outside the service area. In this example, 48 becomes 36 usable leads.
- Recalculate on the clean number. NZ$2,400 ÷ 36 is NZ$66.67. Nothing changed in the ad account, yet the counting rule moved the answer by a third. That gap is why two agencies can quote wildly different numbers for the same account.
- Compare like with like. Put the figure against the same period last year or a rolling three-month average. Judging a change you made ten days ago against a month of history tells you nothing useful.
The mechanic behind the division
Underneath sits the relationship that tells you where to look when the number climbs: cost per lead equals cost per click divided by your click-to-lead conversion rate. The Lucid Leads NZ construction cost study puts this plainly: a campaign paying NZ$12 a click at a 10% conversion rate produces a NZ$120 lead, and lifting conversion to 15% drops that to NZ$80 without touching bids. Higher cost per lead almost always traces back to a rising click price or a falling conversion rate, and only one of those is usually within your control.
Track reroofing enquiries directly
Don’t let consent statistics stand in for your own lead demand. The Roofing Association of New Zealand submission on building supplies notes that some reroofing work is exempt from building consent under Schedule 1 of the Building Act, even though the work and products still have to meet Building Code performance requirements. Plenty of the replacement jobs you want never appear in a consent dataset. Count them in your own tracker instead.
One written definition, one date range, one number you can repeat next month. We track every enquiry with call tracking and report what was spent, how many leads came in, what each cost and what changed, so the figure is the same one everyone agreed on.
Factors That Push Your Cost per Lead Up or Down
Two leads at the same price can be worth very different amounts to your business. These are the forces that move the price, roughly in the order they matter.

Intent sets the price before you bid
A homeowner typing “roof replacement quote Auckland” is close to a decision. Someone reading about moss on tiles is not, and clicks on that query can be cheap while producing enquiries that never book. Search advertising took roughly NZ$1.44 billion of New Zealand’s NZ$2.967 billion digital ad market in 2025, about 49%, according to ID.ac.nz’s NZ digital marketing trends. That’s a lot of businesses chasing typed intent, so judge cost per lead by keyword intent rather than as one blended account number.
Competition in your suburbs
New Zealand added roofing businesses steadily for two decades. The count of enterprises classified under roofing services rose from 888 in 2000 to 1,662 in 2024, an increase of about 87%, according to Figure.NZ’s industry chart. More firms bidding on the same replacement queries in Auckland and the larger cities pushes click prices up. A tight service radius makes it worse, because you’re competing for fewer searches.
Service mix matters just as much. Repairs, reroofs, gutters, long-run metal and commercial work each carry different job values, so the same lead price is cheap for one and expensive for another.
The lever you actually control
Conversion rate is where owners make progress without spending more. About 94% of New Zealanders are active online and mobile-phone penetration sits near 92%, per Campaign Asia’s NZ performance marketing briefing, which means most of your traffic is on a phone. If 1,000 visits convert at 3% you get 30 leads. At 6% you get 60, and your cost per lead halves on identical spend.
Weather sits outside all of it. A storm week fills the diary and shifts demand for a fortnight, then it settles. Check three things this month: your search-term report for junk queries, your mobile conversion rate, and the split of leads by service type.
Cost per Lead Versus Cost per Booked Job
Two thousand dollars a month at NZ$40 a lead reads like a healthy account. Follow those same people through your pipeline and the picture changes quickly.
| Funnel stage | Count | Cost per item (NZ$) |
|---|---|---|
| Raw enquiries (forms and calls) | 50 | 40 |
| Qualified roofing enquiries | 20 | 100 |
| Booked inspections or estimates | 8 | 250 |
| Signed jobs | 3 | 667 |
Fifty raw enquiries is what the dashboard reports, and at NZ$40 each that looks like a machine running well. Then you read them. Twenty are genuine roofing enquiries from people who own the property and want the work done, so each qualified enquiry costs NZ$100.
Eight of those agree to an inspection or a written estimate. Now you’re at NZ$250 per booked appointment, before anyone has climbed a ladder. Three sign. Set against the original NZ$2,000, each signed job has cost you about NZ$667, which is either excellent or alarming depending on whether those jobs are gutter repairs or full replacements.
Raw form counts mislead for one reason: they treat every enquiry as equal. An account salted with gutter-cleaning, DIY and training searches produces plenty of cheap leads and very little roofing work. The dashboard looks efficient while the calendar stays empty.
The comparison that matters: a NZ$40 repair enquiry and a NZ$100 replacement enquiry are not the same purchase. The replacement lead costs more than twice as much and may be worth many times the revenue. Cheaper is not automatically better.
For reference, Bluelight clients see an average ad spend of $560 per booked job, which is a more useful yardstick than any published cost-per-lead average because it follows the money to the job.
If you also buy leads or pay referral incentives, apply the same test to those. A referral fee only makes sense if it sits comfortably below your own cost per booked job, and programmes with referral payout caps and tier gates show how those ceilings get structured. Cap what you’ll pay per booked job and hold the line, whether the lead arrives through Google or through a mate on a building site.
Report cost per qualified lead and cost per booked job next to cost per lead, every month, and judge each against the target you set below.
Fixing a High Cost per Lead Without Cutting Your Budget
Cutting the daily budget is the most common response to a rising cost per lead, and the least effective. It reduces the invoice and leaves the cause untouched. With Google holding an estimated 96.8% share of New Zealand search, as NZ Herald reported, there’s no second auction to move to. The waste is sitting inside your account.
Match the symptom to the cause
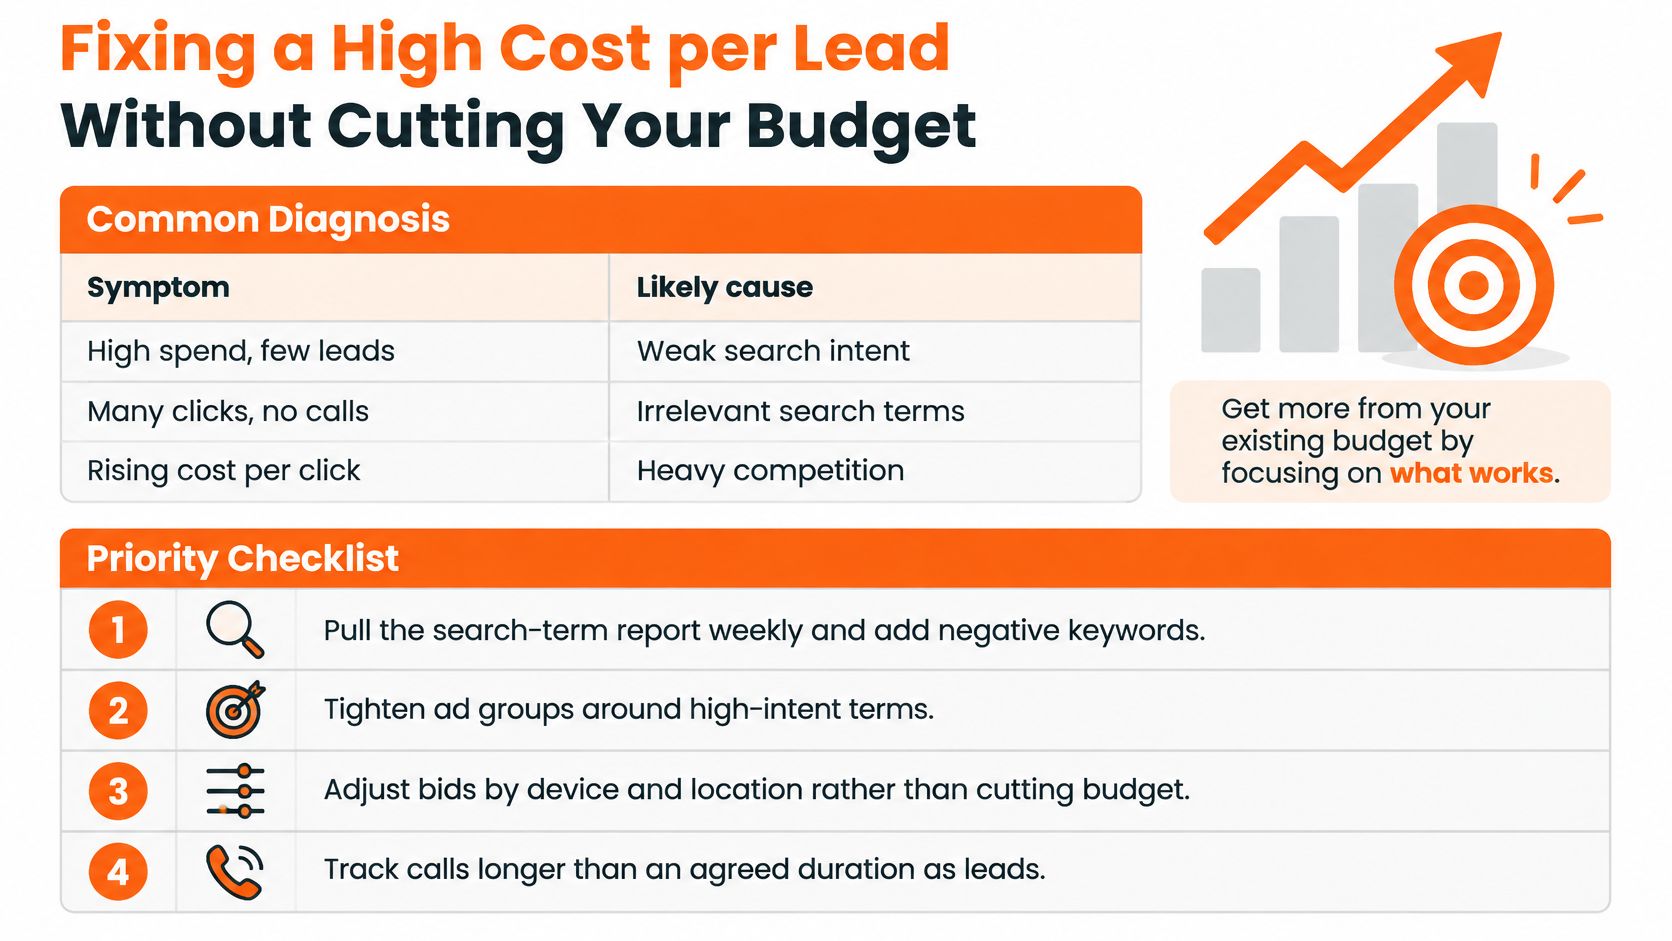
| Symptom | Likely cause | First fix |
|---|---|---|
| Low cost per lead but few booked jobs | Research or DIY searches fill the leads | Add negative keywords and check the search-term report weekly |
| Clicks arrive but few calls or forms | Slow or hard-to-use mobile page | Put a tappable phone number above the fold and shorten the form |
| Cost per lead spikes in one area | Bids too high for a competitive suburb | Narrow the service area or lower bids on weak terms |
| Many leads but poor quality | Broad ad copy with no pre-qualifying detail | Name the service, area and price approach in ads and landing pages |
Work through the fixes in this order
- Kill the junk searches first. Pull the search-term report weekly and add negatives for DIY, jobs, training, suppliers and product-only queries. This is the cheapest change you’ll make all month.
- Split campaigns by service and suburb. One campaign for reroofs, one for repairs, one for gutters, each with ads and a landing page written for that job. Blended campaigns give you blended, unusable numbers.
- Put the phone number above the fold on mobile. Tappable, visible without scrolling, repeated once near the form.
- Shorten the form to four fields. Name, phone, suburb, job type. Every extra field is a reason to leave.
- Pre-qualify in the ad copy. Name the service, the area, and what happens at the inspection. Price shoppers filtering themselves out is a result, not a loss.
- Change one thing at a time and give it two to four weeks. Judging a landing page rewrite after two days tells you about a Tuesday, not about the page.
Here’s how that looks in practice on the conversion side.
Homeowners want guidance before they want a price. A 2026 Master Builders survey of more than 1,200 respondents, including over 600 homeowners, found that 63% turn to their builder for project information, according to Master Builders’ State of the Sector. A page that explains repair-versus-replacement scenarios and what an inspection involves earns the call. Our work on conversion rate optimization is built around exactly that, and it lowers cost per lead by raising the number of enquiries per hundred clicks.
“Bluelight cut our cost per lead by a third and doubled our website conversion rate. We’re getting roughly twice the leads for the same spend. Outstanding results!”, Rachel Hunter, Operations, Streamline Kiwi
Log every change with its start date. When the next review comes around, you’ll know which fix did the work instead of guessing at the month as a whole, and a lower cost per lead only counts if cost per booked job falls with it.
Setting a Target Cost per Lead You Can Afford
Benchmarks tell you what’s normal. Your margins tell you what’s affordable, and the two aren’t the same thing.
Work backwards from the job. Maximum cost per lead equals your average gross profit per job multiplied by the share of leads that become jobs. Take a replacement worth NZ$18,000 at a 35% gross margin: that’s NZ$6,300 of gross profit. If one in ten leads becomes a job, you can pay up to NZ$630 a lead and still make money.
Now a repair worth NZ$900 at 40% margin, so NZ$360 of gross profit. If one in four leads books, the ceiling is NZ$90 per lead.
Same account, same suburb, wildly different ceilings. A NZ$200 lead is comfortable for the first service and loss-making for the second, which is why one blended target for the whole account sends budget to the wrong jobs. Smaller maintenance work has its own cost structure too, and roof cleaning cost factors show how much access, condition and labour move the price of those visits before you’ve made a cent on them.
Two numbers per service, not one
Set a target below the ceiling, the figure you want the account to hit, and a warning level above it that triggers a review rather than a panic.
Volatility is real in a market this size. A directional dataset of NZ paid-social campaigns reported an average cost per lead of about NZ$37.70, with monthly figures ranging from NZ$24.80 to NZ$55.31, according to Scoop’s coverage of NZ digital ad spend. That’s social rather than roofing search, but it makes the point: a monthly average can hide swings of more than double. One bad month is not evidence of a broken campaign.
Consent data won’t settle it either. 36,619 new dwellings were consented in the year ended December 2025, up 9.0% year on year, per the Concrete NZ quarterly insights report, but that measures new build work rather than the replacement market most roofing advertisers compete for.
Review a rolling three-month average, check seasonality and storm-driven demand before cutting anything, and write one target and one warning level for each main service you sell.
Confirm Your Numbers Before You Spend More
- Pull the last 90 days of spend, lead counts and booked jobs from Google Ads and your call tracking.
- Calculate cost per lead and cost per qualified lead using the steps in How to Calculate Your Cost per Lead Step by Step.
- Compare both with the target and warning levels you set in Setting a Target Cost per Lead You Can Afford.
- Identify the funnel stage where cost climbs fastest, then pick your first change from the symptom table in Fixing a High Cost per Lead Without Cutting Your Budget.
- Book an ad account review. Ours is a free 30-minute session covering what’s working, where budget is leaking, and the two or three moves most likely to change the numbers fastest.
The review is worth far more when you arrive with three months of spend, leads and booked jobs, because the recommendations get judged against your figures rather than industry averages. Tight tracking makes that possible, and Google Ads conversion tracking is where it starts.
A lower cost per lead only matters if the leads become booked roofing work. Check the number every month.
If you want to know which of these fixes would move your account first, Bluelight runs Google Ads exclusively for roofing companies and can show you where the budget is leaking. Bring three months of spend, leads and booked jobs to a free 30-minute ad account review, and you’ll leave with the two or three changes most likely to lower your cost per booked job. Start at Bluelight.
Related service Google Ads for Roofers